This post continues from the eleventh part. Architecture diagrams show structure — but not how the system is currently doing. With the overlay feature, external metrics can be placed directly onto draw.io elements as a heatmap.
The Concept
bausteinsicht overlay apply loads a JSON file with metrics and colors the draw.io elements accordingly.
The original colors are saved in diagram metadata — overlay remove restores them exactly.
Typical use cases:
Error rate per service after an incident
Test coverage per module before a release
Latency P99 from Prometheus/Datadog
Deployment frequency from the CI system
Preparing the Metrics File
The metrics are stored in a JSON file with a fixed schema:
{
  "meta": {
    "source": "Datadog",
    "generated": "2025-06-11T06:00:00Z",
    "metric_descriptions": {
      "error_rate": "HTTP 5xx Rate (last 1h)",
      "p99_latency_ms": "P99 Latency in milliseconds"
    }
  },
  "metrics": [
    {
      "id": "shop.frontend",
      "values": {
        "error_rate": 0.02,
        "p99_latency_ms": 145
      }
    },
    {
      "id": "authservice",
      "values": {
        "error_rate": 0.08,
        "p99_latency_ms": 312
      }
    },
    {
      "id": "paymentservice",
      "values": {
        "error_rate": 0.41,
        "p99_latency_ms": 890
      }
    },
    {
      "id": "shop.db",
      "values": {
        "error_rate": 0.01,
        "p99_latency_ms": 22
      }
    }
  ]
}
The id fields must match the element IDs in the model.
Elements without an entry in the metrics file remain unchanged.
bausteinsicht overlay list
Which metrics are available in the file?
bausteinsicht overlay list metrics.jsonOutput:
📊 Metrics from: Datadog (2025-06-11T06:00:00Z)

Available metrics (4 elements):
  • error_rate: HTTP 5xx Rate (last 1h)
  • p99_latency_ms: P99 Latency in milliseconds
bausteinsicht overlay apply
# Show error rate as heatmap
bausteinsicht overlay apply metrics.json --metric error_rate

# Show latency as heatmap
bausteinsicht overlay apply metrics.json --metric p99_latency_ms

# Use a different draw.io file as target
bausteinsicht overlay apply metrics.json --metric error_rate \
  --output architecture-incident.drawio
Bausteinsicht automatically calculates the color scale: low values are colored green, high values red (default color scheme).
After applying, the diagram looks like this (color-wise):
shop.frontend   → light green  (error_rate: 0.02 — low)
authservice     → yellow       (error_rate: 0.08 — medium)
paymentservice  → red          (error_rate: 0.41 — critical)
shop.db         → green        (error_rate: 0.01 — very low)
The diagram opens in draw.io with the heatmap colors. Elements without a metrics entry remain in their original color.
JSON Output
bausteinsicht overlay apply metrics.json --metric error_rate --format json{
"status": "applied",
"metric": "error_rate",
"file": "architecture.drawio"
}bausteinsicht overlay remove
Remove the heatmap and restore original colors:
bausteinsicht overlay removeBausteinsicht reads the saved original styles from the draw.io element metadata and restores each element’s style exactly. No manual color adjustment needed.
Original colors are saved in draw.io element metadata on the first overlay apply. They remain there until overlay remove is executed — even if the draw.io file is committed to Git. |
Generating Metrics from External Sources
The metrics JSON can come from any system. Examples:
Prometheus / Grafana
# Export HTTP error rate of the last hour as JSON
promtool query instant \
  'rate(http_requests_total{status=~"5.."}[1h]) / rate(http_requests_total[1h])' \
  | jq '...' > metrics.json
CI System (Test Coverage)
# Convert coverage report from Go Test into the overlay format
go test ./... -coverprofile=coverage.out
# Then aggregate coverage per service and write to metrics.json
GitHub Actions: Automatic Overlay Before Review
- name: Fetch metrics and apply overlay
  run: |
    curl -s "$METRICS_API_URL" > /tmp/metrics.json
    bausteinsicht overlay apply /tmp/metrics.json --metric error_rate

- name: Upload diagram with overlay
  uses: actions/upload-artifact@v4
  with:
    name: architecture-with-metrics
    path: architecture.drawio
Limitations
Bausteinsicht does not generate metrics — it only visualizes external data
The color scale is linear (Min → Green, Max → Red); no logarithmic scaling
Only numeric metrics are supported — no categorical values
The
--metricflag selects exactly one metric per apply; call multiple times for multiple metrics
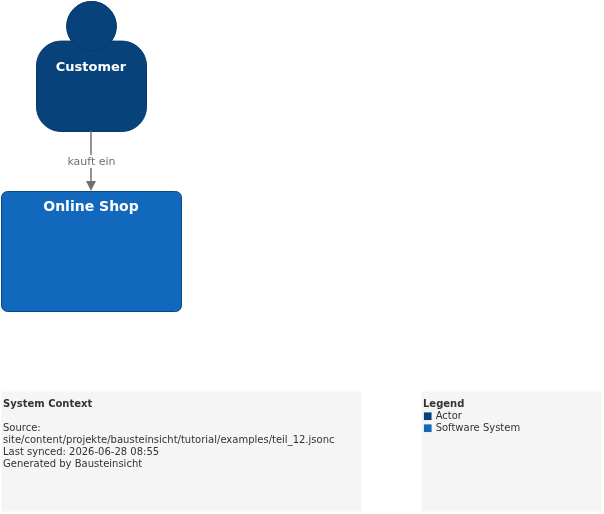
Example Model
The base model for the overlay examples in this part is located at teil_12.jsonc.
This is what the result looks like in draw.io (bausteinsicht sync):
You can find the draw.io file here: teil_12.drawio
Generated PNG files via bausteinsicht export --image-format png:
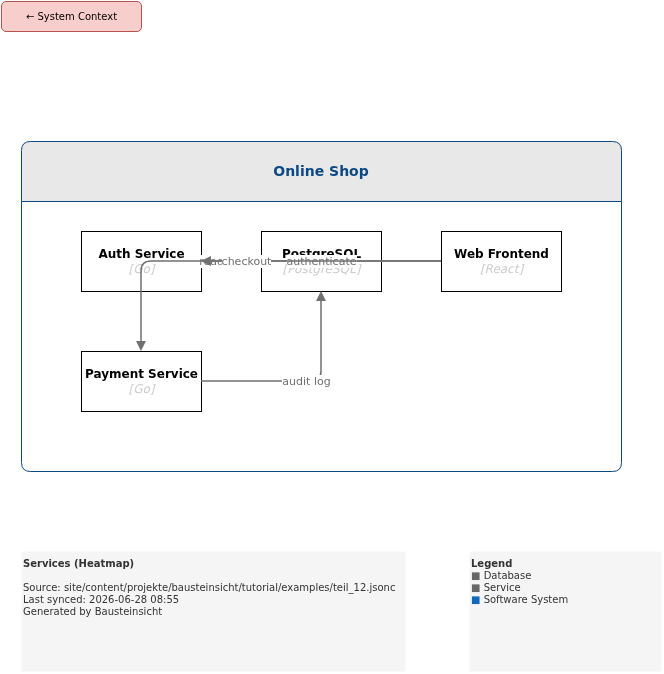
Generated PlantUML diagrams via bausteinsicht export-diagram:
What Comes Next
Part 13: Graph Analysis — Uncover cycles, centrality, and dependency patterns with
bausteinsicht graphPart 14: Auto-Layout — Automatically arrange diagrams hierarchically
Official documentation: User Manual · Tutorial on doctoolchain.org