This post continues from the twelfth part.
Architecture models grow — and with them the complexity of dependencies.
bausteinsicht graph analyzes the relationship graph and makes problems visible that are hard to spot in diagrams.
What is Graph Analysis?
The architecture model is mathematically a directed graph: elements are nodes, relationships are edges. Graph analysis algorithms answer questions like:
Are there cycles? (A → B → C → A)
Which elements are most heavily connected?
Is the graph a DAG (Directed Acyclic Graph)?
Which components form tightly coupled clusters?
bausteinsicht graph
bausteinsicht graph --model architecture.jsoncOutput:
Relationship Graph Analysis
===========================

Summary
-------
Elements: 12
Relationships: 14
Max Dependency Depth: 4
Graph Type: DAG (acyclic)

No cycles detected (valid DAG)

Strongly Connected Components: 3
--------
Component 1 (CYCLE): [shop.api, authservice, shop.frontend]

Centrality Metrics (top 5 by out-degree):
Element                | In-Degree | Out-Degree | Betweenness | Closeness
---------------------- | --------- | ---------- | ----------- | ---------
shop.api               |         2 |          5 |        8.40 |      0.67
authservice            |         3 |          2 |        4.20 |      0.58
shop.frontend          |         1 |          3 |        3.10 |      0.52
Show Only Cycles
bausteinsicht graph --model architecture.jsonc --cycles-onlyQuick check for CI: are there any cycles at all?
Show Centrality Metrics
bausteinsicht graph --model architecture.jsonc --centralityShows for each element:
| Metric | Meaning |
|---|---|
In-Degree | Number of incoming connections — high values: many dependents |
Out-Degree | Number of outgoing connections — high values: many dependencies |
Betweenness | How often the element lies on the shortest path between two others — high values: critical bottleneck |
Closeness | How close the element is to all others — high values: central position in the graph |
Write Report to File
bausteinsicht graph --model architecture.jsonc --centrality \
  --output docs/graph-report.txt
JSON Output
bausteinsicht graph --model architecture.jsonc --format json{
"element_count": 12,
"relationship_count": 14,
"max_depth": 4,
"is_dag_valid": false,
"cycles": [
{
"length": 3,
"elements": ["shop.api", "authservice", "shop.frontend"]
}
],
"components": [
{
"id": 0,
"elements": ["shop.api", "authservice", "shop.frontend"],
"is_cycle": true
}
],
"centrality": [
{
"id": "shop.api",
"in_degree": 2,
"out_degree": 5,
"betweenness": 8.4,
"closeness": 0.67
}
]
}Cycles in the Architecture
A cycle (A → B → C → A) in the architecture means:
Deployment dependencies are circular — none of the involved systems can be deployed independently
Testability suffers — components cannot be tested in isolation
Hidden coupling — the systems cannot be evolved independently
Circular dependencies can also be defined as a no-circular-dependency constraint (→ Part 8) and automatically checked in CI. bausteinsicht graph additionally outputs the concrete cycles — useful for analyzing which elements are affected. |
Resolving a Cycle
Typical strategies:
Dependency Inversion: introduce a shared interface/abstraction
Event-based decoupling: replace direct calls with events
Introduce a new layer: extract shared logic into a separate element
Centrality as an Architecture Signal
High Out-Degree + high Betweenness = potential monolith or God Object. An element that knows many others and lies on many paths is an architecture risk:
Changes there break many other components
Testing becomes complex
Deployment blocks others
| Centrality values combine well with the overlay feature (→ Part 12): export Betweenness values as a metrics JSON and visualize them as a heatmap. |
CI Integration
- name: Check for architectural cycles
  run: |
    bausteinsicht graph --model architecture.jsonc --cycles-only --format json \
      | jq 'if .cycles | length > 0 then error("cycles detected") else . end'
Alternatively via the no-circular-dependency constraint (simpler, no jq needed):
- name: Lint architecture
  run: bausteinsicht lint  # fails if NO-CYCLES constraint is violated
Example Model
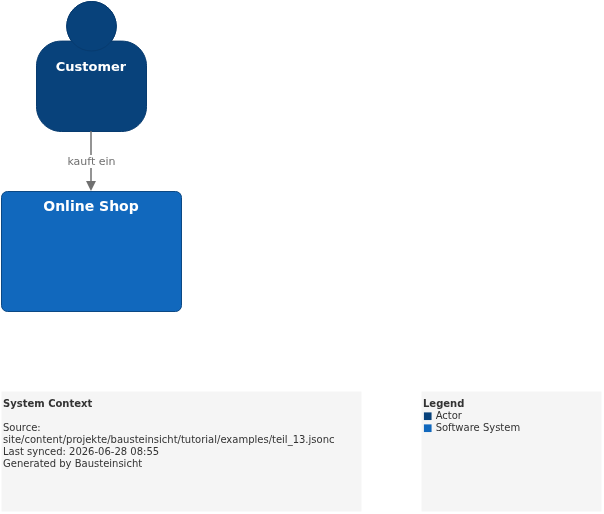
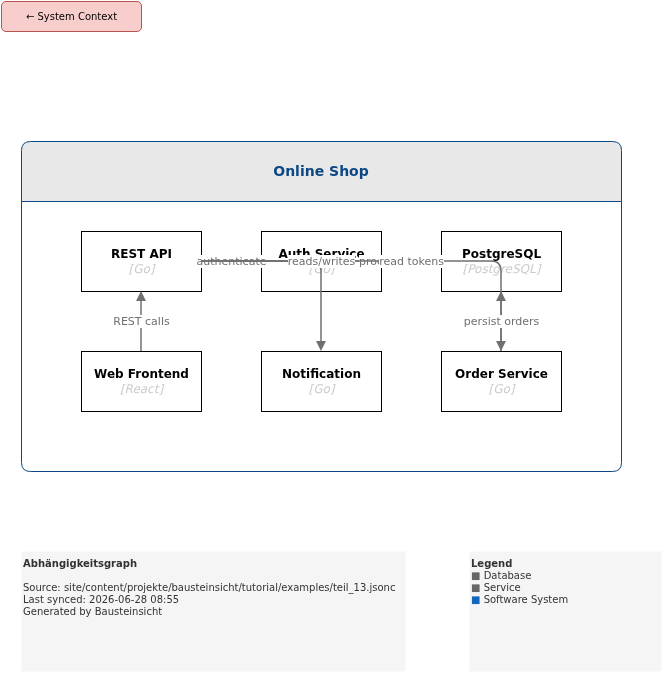
The example for this part (REST API as a central hub with high Out-Degree) is located at teil_13.jsonc.
This is what the result looks like in draw.io (bausteinsicht sync):
You can find the draw.io file here: teil_13.drawio
Generated PNG files via bausteinsicht export --image-format png:
Generated PlantUML diagrams via bausteinsicht export-diagram:
What Comes Next
Part 14: Auto-Layout — Automatically arrange diagrams hierarchically
Part 15: Templates — Define custom visual styles for element types
Official documentation: User Manual · Tutorial on doctoolchain.org