Every embedded developer uses it daily, yet it’s rarely explained systematically: the debug interface between hardware and software. This post goes from the hobbyist toolchain (ST-Link/J-Link + OpenOCD/GDB) to the professional Lauterbach TRACE32 debugger, the industry standard in automotive/AUTOSAR development.
JTAG vs. SWD
Both are debug access protocols for the ARM debug port, but they differ significantly in pin count and typical use case:
| JTAG | SWD | |
|---|---|---|
Pins | TDI, TDO, TCK, TMS (+ optional TRST) — at least 4-5 | SWDIO, SWCLK — only 2 |
Multi-device chains | Yes, multiple chips in one chain (daisy-chain) | No, one target per connection (though some Cortex-M variants support SWD multi-drop) |
Prevalence on Cortex-M | Rarer, usually present alongside SWD | Standard — most Cortex-M boards only break out SWD pins |
On Cortex-M, SWD is in practice almost always the right choice: fewer pins on the board, same feature set for single-core debugging. JTAG becomes relevant mainly when multiple chips sit in one chain, or a SoC explicitly offers no SWD port — not uncommon for larger automotive SoCs with multiple cores/domains. |
Debug probe hardware at a glance
| Level | Tool |
|---|---|
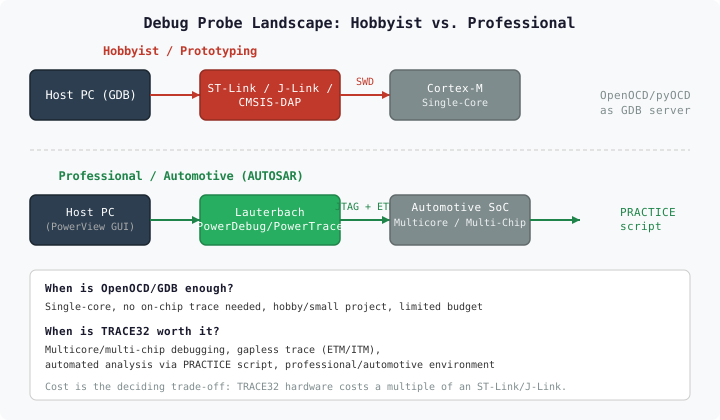
Hobbyist/prototyping | ST-Link (cheap, STM32-focused), J-Link (SEGGER, broad chip support, pricier), CMSIS-DAP (open standard, often built into eval boards) |
Professional/automotive | Lauterbach TRACE32 (PowerDebug/PowerTrace hardware) — far more common in professional settings than the hobbyist toolchains, thanks to multicore debugging, trace capabilities, and the PRACTICE scripting language |
GDB server workflow as an entry point
The classic entry point runs through a GDB server that mediates between GDB and the debug probe:
# Start OpenOCD as a GDB server (example: ST-Link + STM32F4)
openocd -f interface/stlink.cfg -f target/stm32f4x.cfg

# In a second terminal: connect GDB
arm-none-eabi-gdb firmware.elf
(gdb) target remote localhost:3333
(gdb) load
(gdb) break main
(gdb) continue
pyOCD is a Python-based alternative to OpenOCD with particularly good CMSIS-DAP support — functionally
comparable for getting started, but with simpler board configuration through a built-in chip database
instead of manual .cfg files.
This workflow is entirely sufficient for most single-core Cortex-M projects.
Lauterbach TRACE32 in detail
Architecture
TRACE32 consists of three parts: the PowerDebug/PowerTrace hardware (the actual debug probe equivalent, but with additional trace memory), the PowerView GUI, and the PRACTICE scripting language that drives both.
Multicore and multi-chip debugging
Automotive SoCs typically have multiple cores (e.g. a lockstep Cortex-R pair for safety functions plus a Cortex-A cluster for infotainment/high-level software) — sometimes even spread across multiple physical chips (e.g. a separate security controller). TRACE32 can halt all cores/chips simultaneously (a synchronous stop across all cores — important when a bug emerges from the interaction of two cores) and debug all of them in a single PowerView instance with multiple windows at once.
On-chip trace (ETM/ITM)
The decisive difference from a plain GDB setup: TRACE32 can record gapless execution trace via ETM (Embedded Trace Macrocell) or ITM (Instrumentation Trace Macrocell) — every branch taken, not just the state at a breakpoint. A GDB-only setup always shows just a snapshot at the point of the halt; ETM/ITM shows the full path leading up to it, including sporadic failure conditions that don’t reproduce reliably. |
A simple PRACTICE script
PRACTICE (.cmm files) automates recurring debug sequences:
; breakpoint_check.cmm — set a breakpoint, let it halt, evaluate registers
Break.Set main.c\42
Go
WAIT !STATE.RUN()
PRINT "PC:  " R(PC)
PRINT "SP:  " R(SP)
PRINT "CFSR:" D.Long(0xE000ED28)
IF D.Long(0xE000ED28)!=0
(
  PRINT "Fault status non-zero — hard-fault analysis needed"
)
ENDDO
This script sets a breakpoint, lets execution run, waits for the halt, and automatically evaluates the
fault status register (CFSR) — useful for automated regression runs hunting a sporadic bug across many
iterations.
When OpenOCD/GDB suffices, when TRACE32 pays off
| Criterion | Decision |
|---|---|
Single-core, small project | OpenOCD/GDB is sufficient |
Multiple cores/chips that must be halted synchronously | TRACE32 — GDB multi-target setups are noticeably more fragile here |
Sporadic bug that doesn’t reproduce | TRACE32 with ETM/ITM trace — GDB only shows the state at the halt, not the path there |
Budget | TRACE32 hardware costs a multiple of an ST-Link/J-Link — the premium only pays off once the above needs actually arise |
Practical debugging: breakpoints, registers, hard-fault analysis
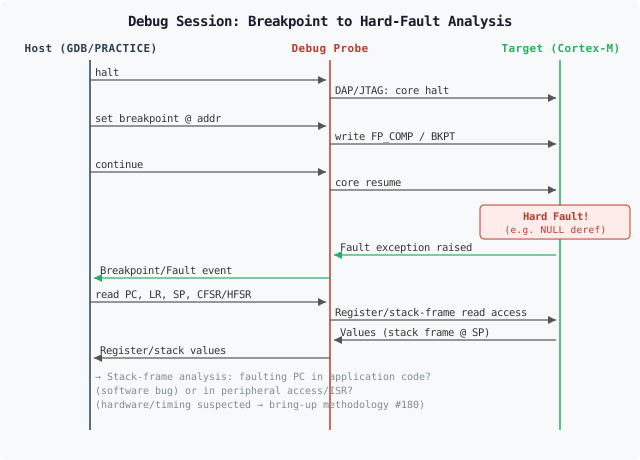
Using a NULL-pointer access that triggers a hard fault as an example — shown once with GDB, once with TRACE32/PRACTICE:
# GDB: after a hard fault
(gdb) info registers
(gdb) x/8xw $sp        # inspect the stack frame at the time of the fault
(gdb) print/x *(uint32_t*)0xE000ED28   # read CFSR
; TRACE32/PRACTICE: equivalent
PRINT R(PC),R(LR),R(SP)
Data.dump SP++32
PRINT D.Long(0xE000ED28)The stacked frame at the hard fault (R0-R3, R12, LR, PC, xPSR) reveals which instruction caused the fault — the crucial step afterward is classifying it:
If the faulting PC address points into your own application code (e.g. dereferencing an uninitialized pointer), it’s typically a software bug. If it points into a peripheral register access, or the fault only occurs under load/specific timing, that points more toward a hardware/timing problem — this is where the general bring-up methodology applies (systematic narrowing from multimeter to protocol analyzer). |
Summary
| Aspect | Key takeaway |
|---|---|
JTAG vs. SWD | SWD is almost always the right choice on Cortex-M — fewer pins, same feature set for single-core |
Hobbyist toolchain | ST-Link/J-Link/CMSIS-DAP + OpenOCD/pyOCD is entirely sufficient for single-core projects |
TRACE32 | Pays off for multicore/multi-chip debugging, sporadic bugs (ETM/ITM trace), and automated analysis via PRACTICE |
Hard-fault analysis | Evaluate the stack frame at the time of the fault, then classify it: application code (software) or peripheral/timing (hardware) — both debuggers yield the same raw data, just with different convenience |